
What is your Austin Police pension worth? This interactive Excel spreadsheet (You must open it in either Microsoft Excel or Google Sheets for the formulas to work) will give you a good idea of what your pension will be worth to you, year by year, for as long as you live (up to 95 years).
You can even put in your own assumptions, including a multiplier, pension rate of return, discount rate, cost of living adjustment (COLA), inflation rate, expected age at death, member contribution rate, and city contribution rate. The chart will automatically adjust, and you can see what impact the changes make.
Note that this valuation spreadsheet is for someone who would choose the single life annuity option (page 13 in the benefits guide) with no survivor annuity.
Before we dive in, here’s a brief on how a pension works.
How does a pension work?
Think of it this way – how much money would you need in an investment account to earn a guaranteed $60,000 per year for the rest of your life? If you could earn 6% every year, then you would need $1 million in the account. That account would generate $60,000 no matter how long you live. When you die, your survivors would receive the $1 million that is left over. If you started with less than $1 million in the account, the payout would exceed the account’s annual earnings, and the balance in the account would drop at an accelerating rate. You would risk outliving the funds in the account and running out of money before you die.
A pension is a bit different because it doesn’t need money left over to be paid to your heirs when you die; the ending value is zero. If the average pensioner in a pension system is expected to live 30 years after retirement, instead of needing $1 million to make that annual $60k payout on a 6% return, participants would only need to put about $850,000 into the pension. The balance would fall to zero at the same time that you die.
Every year, the account would pay out more money than it generates and gradually decline in value. If you die 20 years into retirement, the remaining balance, which could be hundreds of thousands of dollars, stays in the pension. If you live 40 years into retirement, the extra money needed would come from the money left over from people who died short of 30 years. Some people do well in a pension, and others who die early in retirement subsidize people who live longer.
The benefit of pensions is that participants can put less money into the system and end up getting a higher benefit payment for less risk than they could have gotten from a 401k. Typically, older people cannot take the risk of volatility by investing heavily in higher-earning equity investments in their retirement accounts. They may have to play it safer in bond funds, earn less than that 6% rate of return, and either have to start with a higher balance or accept less of an annual payout. Plus, people who rely on 401k’s have to over-fund their account to ensure that they don’t run out of money.
But a pension essentially lives forever. It can ride out periods of volatility, invest heavily in equities, and earn higher return on the funds in the pension indefinitely, which reduces the amount participants have to contribute.
The downside is that you are pooled into a large system that you don’t control. Political meddling, mismanagement, or rosy pension assumptions that don’t materialize could leave you with an underfunded pension and benefit cuts late in your life.
How does this spreadsheet work?
This sheet (<– click to download) works in Microsoft Excel and Google Sheets. If you are on a Mac, you will need to download the file and then upload it into Sheets for the formulas to work or open it in Microsoft Excel. The formulas are not adapted for Numbers.
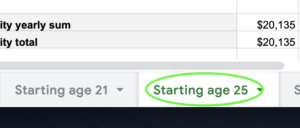
Step 1: Pick your start age. This spreadsheet has three parts. The first part is putting in data that fits your situation. The first step is to choose the tab at the top or bottom of the page that most closely matches how old you were when you started the academy. The pension is much more valuable to people who started at a younger age.
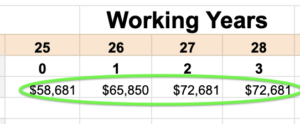
Step 2: Put in your salary data. For the sake of simplicity and ease of use, the Working Years section of the spreadsheet assumes that the purchasing power of your salary will keep up with inflation, so use this year’s pay scales to put in the salary numbers from year 0 to 22 going back to when you started the academy. If you promote or expect to promote at a certain year in your career, put in the pay for that rank using this year’s numbers. The default example in the sheet and shown in the images in this article is someone who promotes to detective at year 13 and retires at the same rank. The average of your highest three years will automatically compute in the Assumptions box (see below).
Step 3: Choose your assumptions. Or don’t, and just use the default assumptions, which reflect the current numbers used by the Austin Police pension.
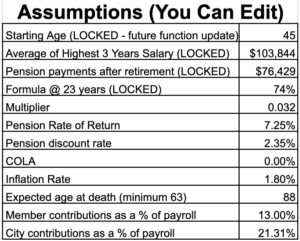
The top four boxes are locked, but the rest you can modify and see how they affect the pension valuations. The default pension discount rate is a rate that is just over the current 10-year U.S Treasury Bond rate. Considering that your pension retirement benefit (theoretically) has an extremely low risk of default due to it being (hopefully) being backed by the taxing authority of the City, a low discount rate is used. Putting in a higher discount rate lowers the present value of your Pension Value at Retirement (see below).
The annual COLA (cost of living adjustment) has been zero for fourteen out of the past fifteen years (see page 109 of the 2017 financial report, COLA’s Paid to Retirees and Beneficiaries). COLA’s will likely remain at 0% until the funding level of the pension reaches 80%, which could be many years down the road. The 2017 funding ratio was 65.7% (see page 16 of the financial report), and the funding ratio has been on a long-term decline since it’s peak of 81.9% in 2001.
The average inflation rate over the past 10 years has been about 1.8%. You can put in a higher number if you are worried about the national deficit and think inflation will be higher in the future.
You can adjust member and City contributions to see how it would impact the Pension Balance at Retirement (see below).
Step 4: Check out the Working Years results. The Working Years section shows how much money you put into the pension annually based on your salary, your cumulative contributions, the City’s contributions, and what today’s present value of your future pension benefit is worth (based on the assumed rates of return on the pension and the discount rate).
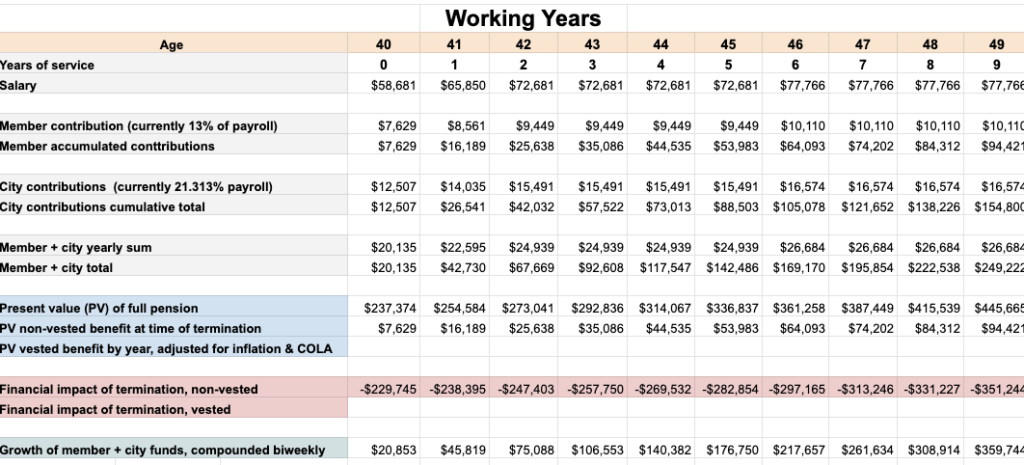
It also shows the impact of leaving before you are either vested or before you reach your full pension benefit (see Financial Impact of Termination, vested or non-vested). This is the difference between the present value of your pension and either what your member contributions refund would be or the present value of your vested benefit once you turn 62. This number is much higher for people who start young rather than those who start the academy when they are in their 40’s.
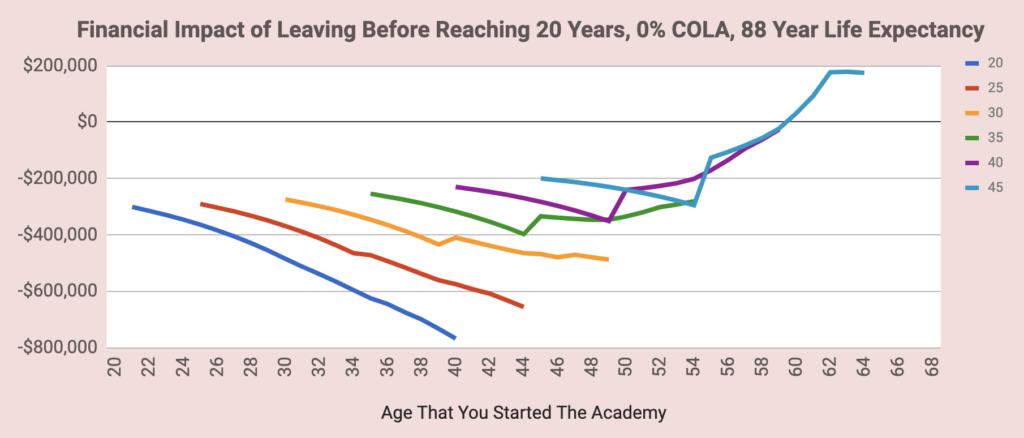
For example, a corporal/detective that starts the academy at age 20.5 but leaves APD at year 19 would have to wait until age 62 to receive a benefit. The financial difference between staying to 23 years to get an immediate benefit and leaving and not receiving a benefit until age 62 (assuming a 0% COLA) is approximately $800,000.
For people who start when they are 45, you may find that your lifetime benefit could be higher if you retired at age 62 with 17 years of service than waiting until you’re 68 with 23 years.
The Working Years section culminates in your personal Pension Valuation at Retirement. This number is largely based on the age you started the academy, future COLA’s, your expected age at death assumption (default is 88) and the discount rate chosen.

As a thought exercise, I’ve included a “Pension Balance at Retirement” calculation which is shown below the Pension Value at Retirement. This number calculates what your contributions and the city’s contributions grew to at the pension’s assumed rate of return. You might notice that the value of your pension at retirement isn’t the same as the pension balance at retirement. Although your contributions and the City’s may have grown to $1.6 million (as the example above shows), that doesn’t necessarily mean the benefit you will receive is worth as much, especially for officers who started the academy in their 40’s. If you promote to higher ranks, and especially if a COLA is ever paid, the value of your pension could greatly exceed the actual value of the funds from your and the City’s contributions.
I’ve also included line 57, Member + City Funds Balance After Retirement in the Retired Years section. Depending on your pension payout, pension rate of return, expected age of death, and contribution rates you’ve chosen, you can see how long your hypothetical funds in the pension would either grow or fall to zero.
Step 5: Check out the Retired Years results. The Retired Years section is heavily impacted by the COLA assumption. Without a COLA, you receive the same fixed benefit every year. Without a COLA, that fixed benefit buys fewer and fewer goods as time goes by and inflation erodes your purchasing power. Input a higher COLA in the Assumptions box and see how it impacts your benefit during your retired years.
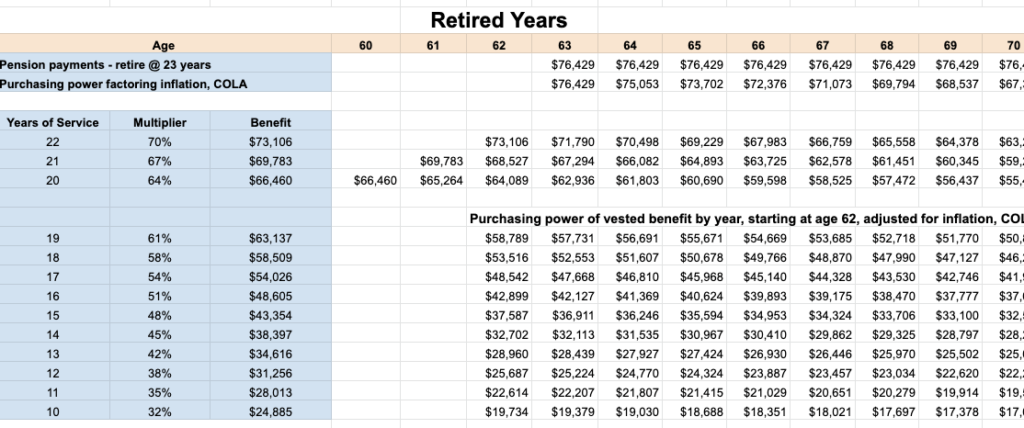
The Retired Years section will zero out the years after your expected age of death. If you put in 70 as your expected age of death in the Assumptions box, every year after age 69 will be a $0. Your Pension Value at Retirement (and many of the present values shown in the Working Years boxes) is a present value calculation based on the Retired Years cash flows, so the shorter you live, the lower the Pension Value at Retirement will be.
The Charts tab (next tab after the Starting Age 45 tab) has two charts that automatically adjust based on the assumption numbers you put in your particular Starting Age tab.
Enjoy the spreadsheet
The goal of this spreadsheet is to educate people about the value of their pension, encourage people to supplement their future benefit by contributing to their deferred comp account, and highlight how important it is to protect the solvency of the pension so they don’t get benefit cuts (or indefinite zero percent COLA’s) later in life.
If you tinker with the worksheet but screw up the formulas, just click here to download a new copy.
Don’t base your retirement decisions off of this chart. Always consult your pension and financial advisors before making retirement and investment decisions.
This is Version 1 of the pension spreadsheet. Check back later for updated versions that add new functionality.